
Nonprofit Fundraising Metrics: 2026 Strategy & 40 KPIs


Your fundraising revenue went up last year. Your board is thrilled. Your annual report looks great.
But here's the problem: you might actually be shrinking.
That's the uncomfortable truth hiding inside 2026 fundraising data. Total U.S. charitable giving reached $592.50 billion in 2024, up 6.3% in current dollars. Sounds healthy, right?
Look deeper. The Fundraising Effectiveness Project's full-year 2024 report tells a different story: dollars rose 3.5%, but donors fell 4.5% and retention dropped 2.6%.
Fewer people giving. More money coming from fewer wallets.
That's not growth. That's concentration risk wearing a growth costume.
The right nonprofit fundraising metrics would have caught this early. The wrong ones, or no metrics at all, let it sneak up on you until a single major donor departure blows a hole in your budget.
This article walks you through a practical fundraising measurement framework built for 2026 realities. You'll get a clear framework, 40 actionable fundraising KPIs with formulas, benchmark context from primary sources, and a strategy for turning numbers into better decisions.
Whether you run a small charity, a mid-size foundation, or a large development team, these are the fundraising performance metrics that actually matter right now.
Key Takeaways
Why Fundraising Metrics Matter in 2026
Fundraising metrics are not just reporting tools. They are a control system for fundraising effectiveness, covering budgeting, staffing, stewardship, channel mix, and campaign timing.
And in 2026, that control system needs to account for some uncomfortable trends.
The 2026 fundraising reality: fewer donors, more dollars
This phrase keeps showing up in sector data because it keeps being true.
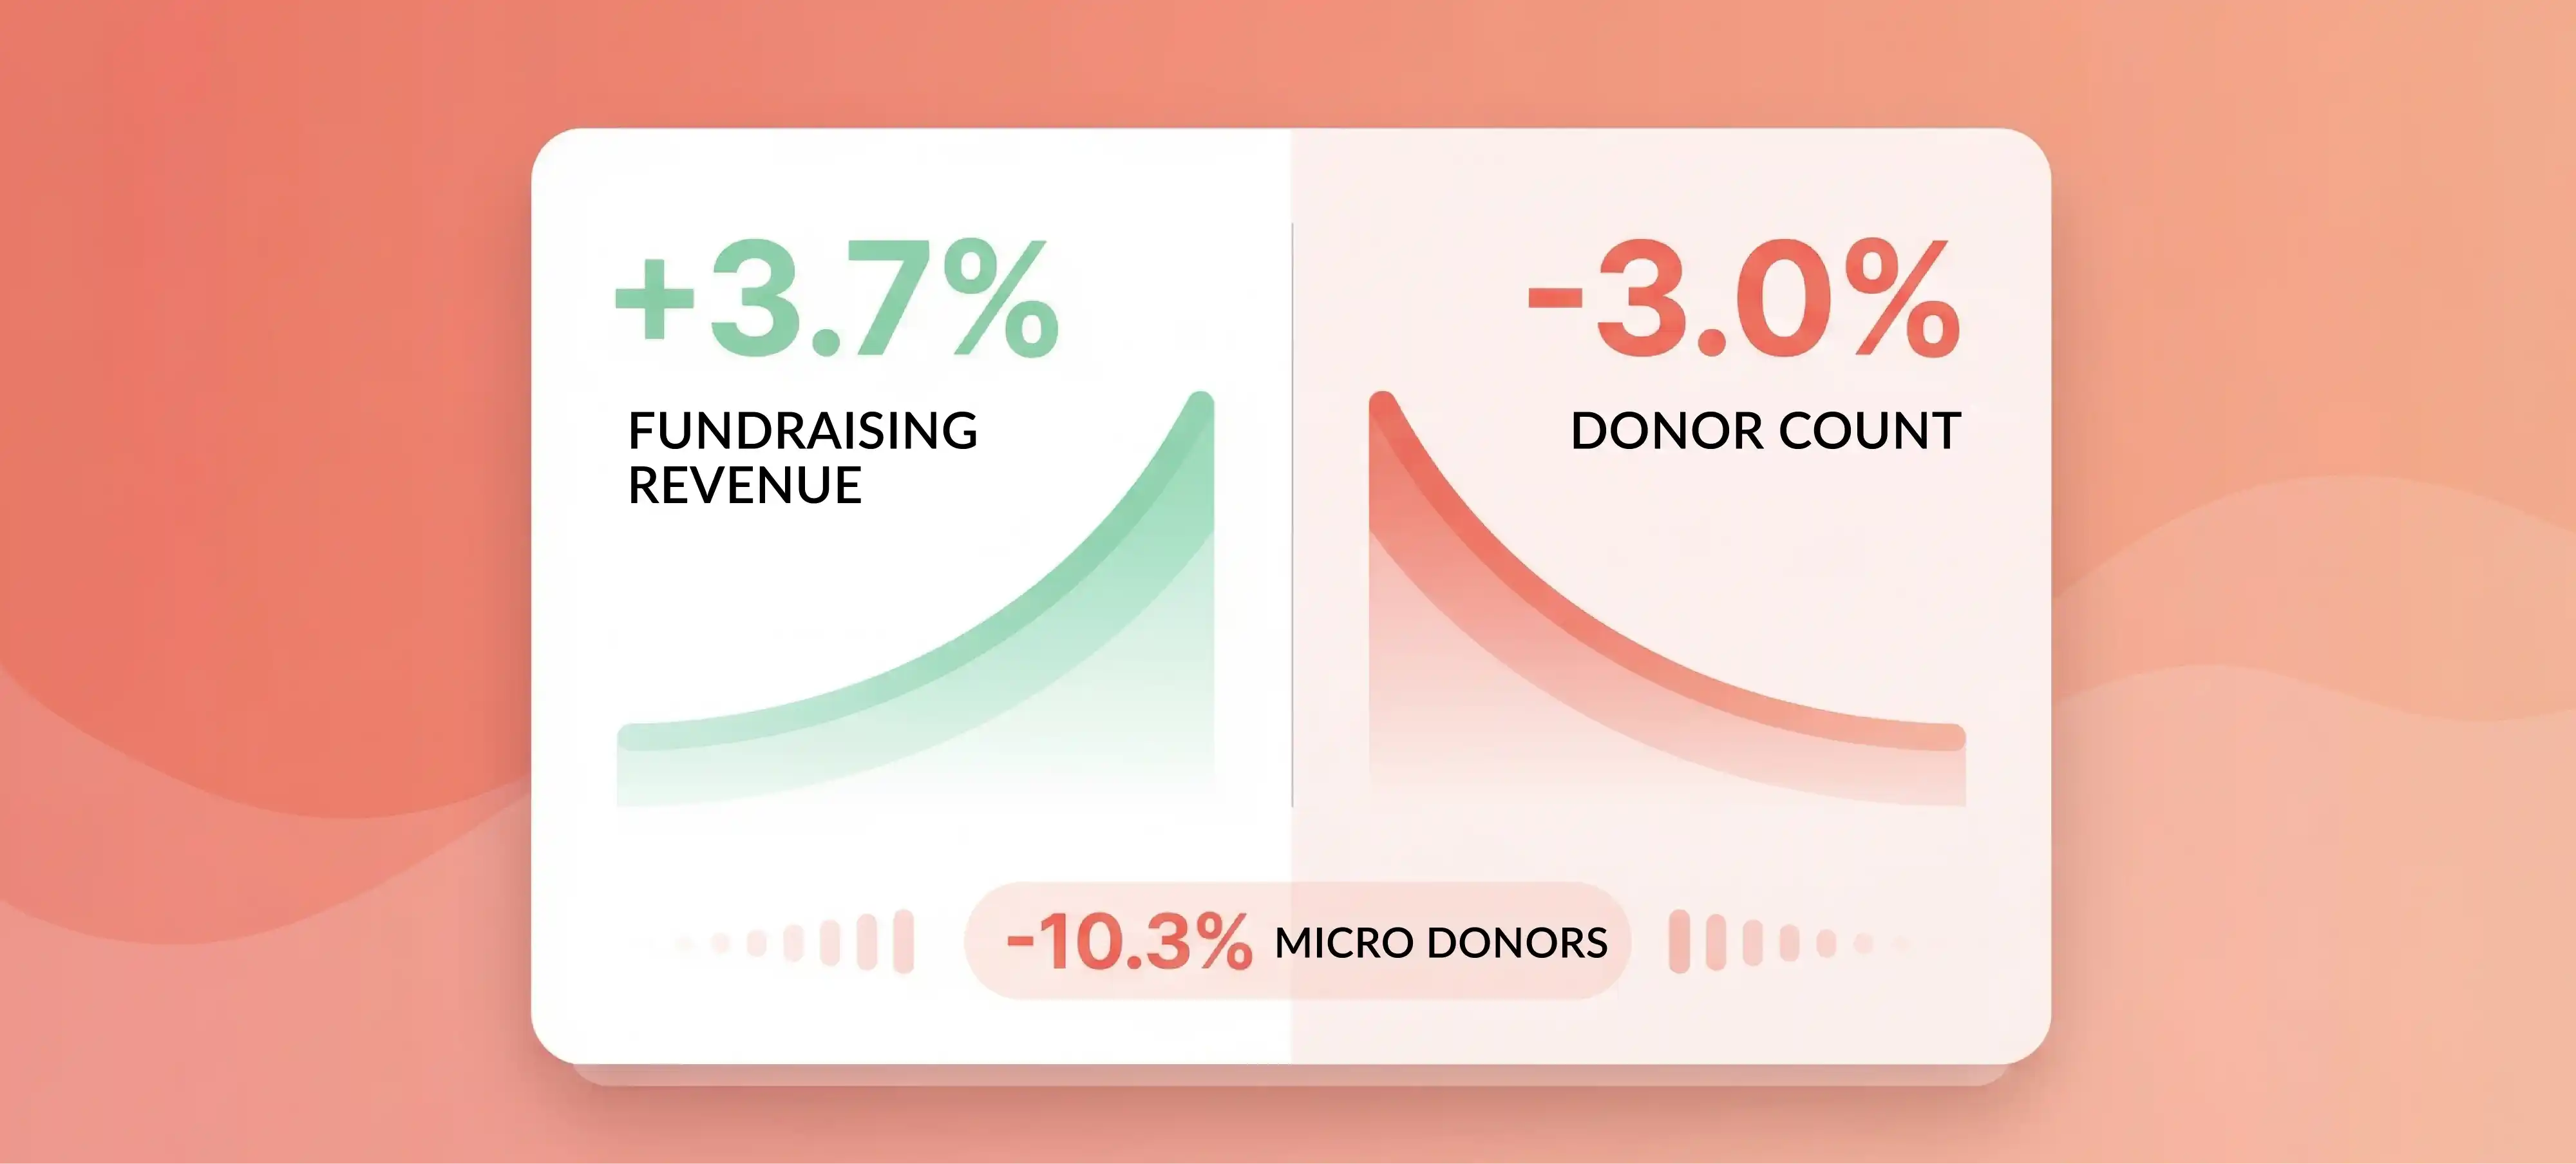
The FEP's Q3 2025 year-to-date report estimated donors down 3.0% year-over-year while dollars rose 3.7%. Micro donors ($1 to $100) made up 50.9% of the donor base but declined 10.3%. Supersize donors ($50K+) represented just 0.4% of donors yet contributed more than half of all dollars.
Blackbaud's 2025 data spotlight frames the same pattern: gifts of $1,000 or more grew about 4.7%, while gifts under $1,000 declined 1.1%. Large organizations saw roughly 11.7% revenue growth. Small organizations? Down about 6.4%.
If your only fundraising metric is total funds raised, you can look perfectly healthy while your donor base quietly erodes underneath.
Why gross revenue is an incomplete metric
Gross revenue is the number most boards see first. And it can be deeply misleading.
Events are the classic example. One Reddit post-mortem of a nonprofit gala revealed that after counting staff time, venue costs, and vendor expenses, the actual return was far less impressive than the headline number.
That's why net fundraising revenue, fundraising ROI, and cost per dollar raised need to sit right next to gross revenue in every report. Without them, you're celebrating effort instead of impact.
Why trustworthy metrics beat vanity metrics
Some metrics simply cannot be trusted in 2026, especially email open rates.
M+R's Benchmarks 2025 found that in a subset of participants able to isolate machine opens, 64% of email opens were machine opens. Apple's mail privacy changes broke the comparability of open rates across systems entirely.
If your team still optimizes subject lines based on open rates, you're optimizing for bots.
Stronger alternatives include email click-through rate, page completion rate, and email revenue per 1,000 fundraising emails. These measure real donor behavior, not automated pings.
Different stakeholders need different metrics
Not everyone in your organization needs the same dashboard.
Boards need a concise fundraising scorecard showing revenue trends, retention, efficiency, and risk. Executives need leading indicators that signal problems before year-end. Development teams need channel-level and lifecycle-level detail they can actually act on.
A common frustration in nonprofit KPI discussions is that organizations default to financial outputs while ignoring donor engagement and mission metrics entirely. The fix isn't abandoning fundraising KPIs. It's naming the layers explicitly and giving each audience the right view.
What Are Fundraising Metrics? Definitions, KPIs, Benchmarks, and Dashboards
Before jumping into formulas, let's get the vocabulary straight. These terms get used interchangeably, but they mean different things.
Fundraising metrics are measurable indicators of fundraising activity, efficiency, donor behavior, and results. They include counts, rates, values, ratios, and trends. Related terms you'll see in practice: charity fundraising metrics, nonprofit performance metrics, development metrics, and donation metrics.
Fundraising KPIs (key performance indicators) are the subset of metrics tied to strategic outcomes or management action. The difference matters. Number of emails sent is a metric. Email revenue per 1,000 emails is a KPI, because you manage against it.
Fundraising benchmarks are comparison points, either external (sector reports), internal (your own last three years), or peer-group (similar organizations by size and mission). Benchmark selection should always be channel-specific and context-aware.
A nonprofit KPI dashboard converts fundraising analytics into decisions by showing trends, targets, ownership, and exceptions. It's not a data dump. It's a decision tool.
The Best Fundraising Benchmarks for Nonprofits in 2026
Benchmarks make fundraising metrics meaningful. But benchmark quality matters enormously. Here are the primary sources worth trusting.
Giving USA provides the macro context. Total giving of $592.50 billion in 2024, growing about 3.3% after inflation, frames what realistic revenue growth looks like sector-wide.
The Fundraising Effectiveness Project (FEP) is foundational for donor retention metrics, acquisition, churn, and recapture benchmarks. Its quarterly reports include explicit uncertainty ranges, which is unusually honest for sector data.
M+R Benchmarks covers digital fundraising metrics with real operational detail. Their 2025 study reports monthly giving at 31% of online revenue, fundraising email CTR at 0.48%, a 12% page completion rate, and an average of $58 raised per 1,000 fundraising emails. On the website side, mobile users made up 53% of visits but desktop drove 55% of transactions and 70% of revenue, with average desktop gifts of $145 versus $76 on mobile.
Blackbaud Institute adds seasonality and concentration context, making it especially useful for year-end fundraising metrics. Their 2025 spotlight reports more than 36% of annual revenue arriving in Q4 and roughly 18% in December alone, plus digital fundraising growth of about 11% year-over-year.
How to use benchmarks without misapplying them
The most common mistake with fundraising benchmark data is treating sector averages as targets.
A 12% page completion rate means something different for a large environmental nonprofit than for a small community foundation. Normalize by organization size, fundraising mix, mission type, and donor-file maturity.
Compare your results to your own last three years first, then your channel peers, then sector-level benchmarks. That order matters.
The 2026 Fundraising Measurement Framework: Outcomes, Drivers, and Risk

A strong measurement system in 2026 has three layers. Skip any one of them and you'll have blind spots.
Outcome KPIs answer "what changed," capturing the fundraising outcomes boards expect to see. Total fundraising revenue, net fundraising revenue, donor retention rate, monthly giving revenue, major gift closes. These are what boards expect and what shows up in nonprofit annual reports. They're also lagging indicators, meaning by the time they move, the cause already happened.
Driver KPIs answer "why it changed." Donation page conversion rate, fundraising email CTR, proposal volume, stage velocity, payment failure rate, stewardship completion. These are leading indicators your team can improve before the lagging outcomes show up.
Risk and integrity KPIs answer "how trustworthy and resilient is our system." Revenue concentration ratio, duplicate and contactability rate, data latency, missing source codes, and the percentage of donors without contact permissions. These matter more than ever because AI adoption is accelerating. M+R reports 78% of organizations used generative AI in marketing or fundraising in 2024, but only 42% had policies in place. Virtuous found 92% of surveyed nonprofits use AI in some capacity. AI amplifies both good and bad data, making data readiness metrics essential for any data-driven fundraising program.
Lagging vs leading indicators
This distinction is worth making explicit.
Lagging indicators include revenue, retention, and net revenue. They tell you what already happened. Leading indicators include donor meetings, qualified asks, donation page performance, email CTR, and payment recovery. They tell you what's about to happen.
Review leading metrics monthly. Revisit strategy quarterly. That rhythm catches problems early without overreacting to short-term noise.
Scaling the framework by organization size
Small nonprofits don't need 40 KPIs. Focus on retention, net revenue, and concentration risk. Use free fundraising tools and a simple spreadsheet to start.
Mid-size teams should add digital and recurring-giving drivers to the core set.
Larger organizations can layer in team productivity, pipeline velocity, and channel-specific scorecards. The framework scales. Start with a few strategic fundraising KPIs and expand as your team grows.
The 40 Most Important Fundraising Metrics for Nonprofits in 2026
This is the core reference, covering the most important fundraising metrics to track. Each KPI below includes what it measures, the formula, and 2026 context.
Apply donor segmentation wherever possible: track by new, retained, recaptured, recurring, major, and by channel or device.
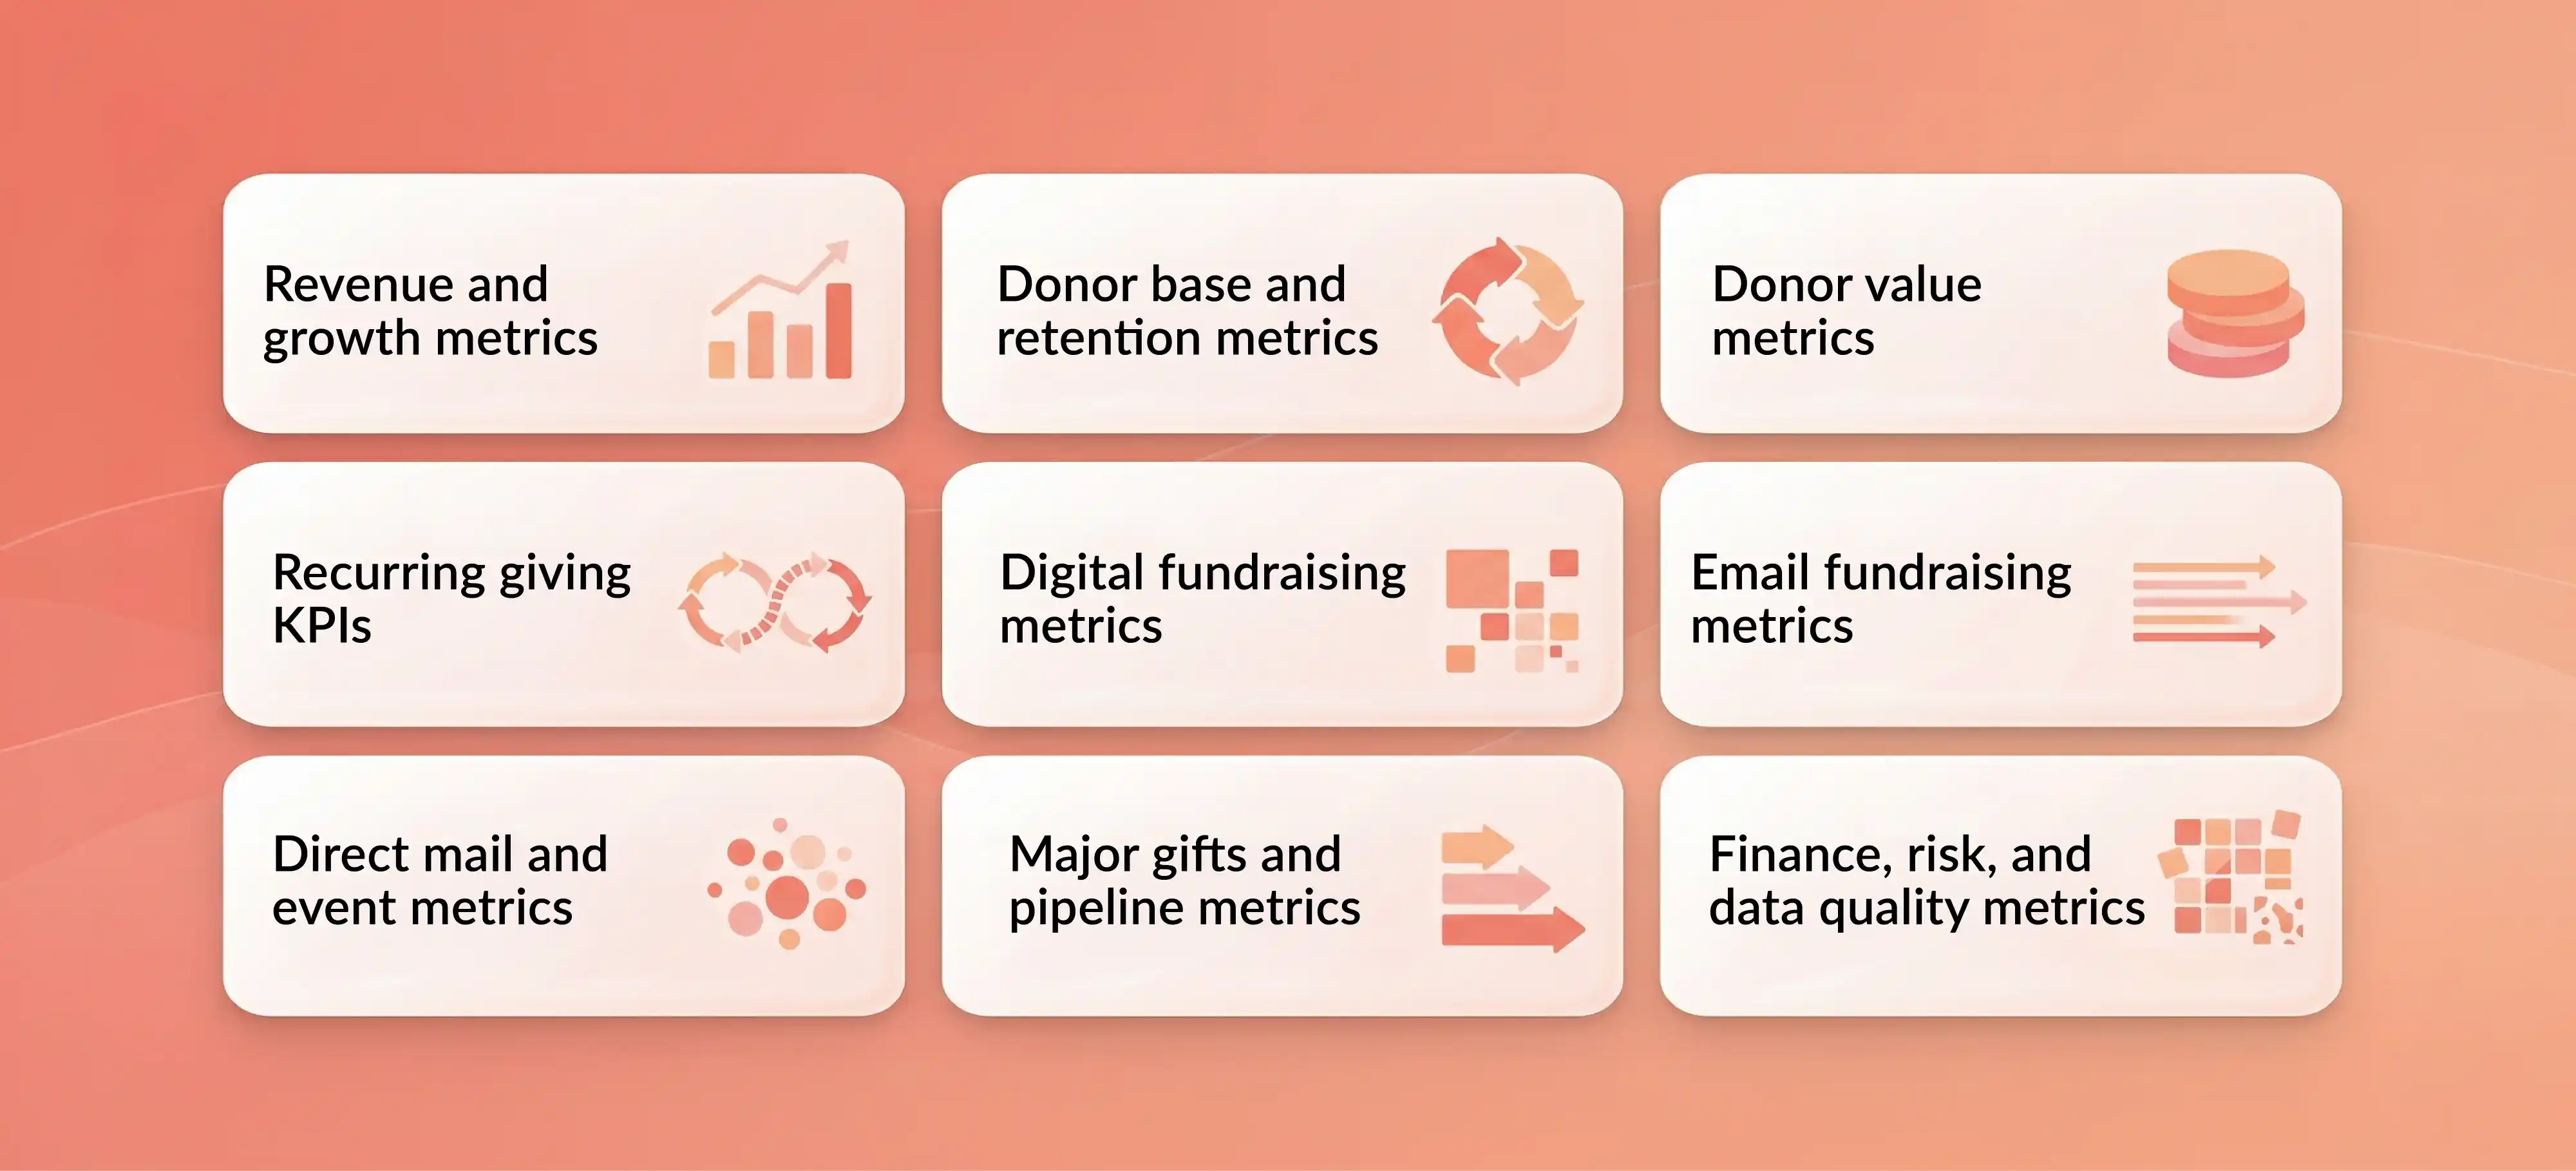
Revenue and growth metrics
1. Total fundraising revenueFormula: Sum of all recognized gifts in period.Why it matters: This is the baseline, but track it alongside donor counts. Revenue alone hides donor-base erosion.
2. Net fundraising revenueFormula: Revenue minus all fundraising costs, including allocated staff time.Why it matters: Prevents celebrating gross revenue when costs spike.
3. Year-over-year revenue growthFormula: (Current year revenue minus prior year) ÷ prior year.Why it matters: Segment by channel and donor tier for real insight.
4. Revenue seasonality share (Q4)Formula: Q4 revenue ÷ annual revenue.Why it matters: Blackbaud reports 36%+ of revenue lands in Q4. Knowing your concentration helps with staffing and cash-flow planning.
5. December revenue shareFormula: December revenue ÷ annual revenue.Why it matters: Critical for year-end staffing and cash-flow planning. ~18% is the sector benchmark.
6. Average gift sizeFormula: Total revenue ÷ number of gifts.Why it matters: Segment by device. Desktop averages $145 vs $76 mobile.
7. Median gift sizeFormula: Median of all gift amounts.Why it matters: Essential when a few large gifts skew the average.
8. Gifts ≥ $1,000 growthFormula: YoY change in count or revenue of gifts ≥$1,000.Why it matters: Growing ~4.7% while smaller gifts decline. Shows whether mid-level and major giving is expanding.
9. Gifts < $1,000 growthFormula: YoY change in gifts <$1,000.Why it matters: Directly tied to donor-base replenishment risk.
Donor base and retention metrics
10. Total active donorsFormula: Unique donors in period.Why it matters: FEP shows donors can fall even when dollars rise. This metric catches that early.
11. New donorsFormula: Donors whose first gift falls in the period.Why it matters: Track by source so you know what creates durable donors.
12. Retained donorsFormula: Donors who gave last year and this year.Why it matters: Define "year" precisely, calendar or fiscal. Inconsistency here breaks your retention math.
13. Recaptured donorsFormula: Donors who gave this year after a lapse.Why it matters: Keep the lapse window consistent so it doesn't drift across reporting periods.
14. Donor retention rateFormula: Retained donors ÷ prior year's donors.Why it matters: 2024 retention declines are a sector-wide challenge. This is one of the most watched nonprofit KPIs.
15. New donor retention rateFormula: New donors last year who gave again ÷ new donors last year.Why it matters: High leverage. Small improvements compound over time.
16. Donor churn rateFormula: 1 minus donor retention rate.Why it matters: Make it visible. Hiding churn is how organizations shrink while appearing to grow.
Donor value metrics
17. Donor lifetime valueFormula: Contribution margin per donor over expected lifespan.Why it matters: Use by segment. Avoid overprecision with a single blended number.
18. Upgrade rateFormula: Retained donors giving more YoY ÷ retained donors.Why it matters: Pair with downgrade rate to explain net revenue changes.
19. Downgrade rateFormula: Retained donors giving less YoY ÷ retained donors.Why it matters: Often reveals stewardship gaps earlier than total revenue does.
Recurring giving KPIs
Recurring donations deserve their own strategic line. They're no longer a nice-to-have.
20. Monthly giving revenueFormula: Sum of monthly/recurring gifts in period.Why it matters: Monthly giving was 31% of online revenue in 2024.
21. Monthly giving share of online revenueFormula: Monthly online revenue ÷ total online revenue.Why it matters: Treat as a strategic ratio, not a vanity stat.
22. Sustainer retention rateFormula: Active sustainers retained ÷ sustainers last period.Why it matters: Define by billing success plus donor intent. This is different from overall donor retention.
23. Payment failure rateFormula: Failed recurring transactions ÷ attempted transactions.Why it matters: Prevents "silent churn." Use dunning and card updater tools to recover.
Digital fundraising metrics
24. Donation page conversion rateFormula: Donations ÷ donation-page sessions.Why it matters: Segment by device. Mobile behavior differs significantly from desktop.
25. Revenue per website visitorFormula: Online revenue ÷ total sessions.Why it matters: Good for UX prioritization, not for campaign ROI.
26. Mobile vs desktop mixFormula: Share of visits, transactions, and revenue by device.Why it matters: Mobile = 53% of visits but desktop = 70% of revenue. Don't blend them into one number.
27. Average gift by deviceFormula: Average gift on desktop vs mobile.Why it matters: Desktop $145 vs mobile $76 is a big gap worth closing.
Email fundraising metrics
28. Email revenue per 1,000 fundraising emailsFormula: Email-sourced revenue ÷ (fundraising emails ÷ 1,000).Why it matters: Benchmark: $58 per 1,000, down 10%. A more trustworthy metric than open rate.
29. Fundraising email CTRFormula: Clicks ÷ delivered fundraising emails.Why it matters: Benchmark is 0.48% for fundraising messages.
30. Page completion rateFormula: Completed actions ÷ action-page starts.Why it matters: Benchmark is 12%, and declining. Shows whether your forms are losing people.
31. List growth rateFormula: Net new subscribers ÷ starting list size.Why it matters: Email lists grew 3% in 2024. A shrinking list compounds email revenue problems.
32. Deliverability hygiene proxyFormula: Tool-specific (machine opens vs human opens).Why it matters: With 64% machine opens, use this cautiously as a deliverability signal, not a performance metric.
Direct mail and event metrics
33. Direct-mail revenue vs online ratioFormula: Direct mail revenue ÷ online revenue.Why it matters: Benchmark: $0.78 raised via direct mail per $1 online. Useful for channel-mix planning.
34. Cost per piece / response rateFormula: Cost ÷ pieces mailed and responses ÷ pieces mailed.Why it matters: Measure for segmentation and creative testing decisions.
35. Event ROI or CPDRFormula: Event expenses ÷ event revenue (CPDR).Why it matters: Include full costs: staff time, vendors, everything. Partial accounting hides losses.
When planning a successful fundraising event, track event registration data alongside event sponsorship revenue to get the full picture.
Major gifts and pipeline metrics
36. Qualified pipeline valueFormula: Sum of qualified asks × probability.Why it matters: Define stages consistently so pipeline doesn't become theater.
37. Stage velocityFormula: Median days in stage.Why it matters: A leading indicator of end-of-year closes. Stalled stages signal forecasting risk.
38. Close rateFormula: Closed gifts ÷ solicitations.Why it matters: Pair with proposal volume and visit volume for full context.
A practitioner thread on major gifts metrics highlights a real frustration: when internal coding rules determine whether a gift "counts," the metric stops measuring performance and starts measuring compliance. Design your KPIs to reward donor-centered movement, not internal games.
Finance, risk, and data quality metrics
39. Revenue concentration ratioFormula: Percentage of revenue from top X donors (e.g., top 10).Why it matters: Concentration risk is growing as smaller donors decline.
40. Fundraising cost to raise a dollar (CPDR)Formula: Fundraising expenses ÷ fundraising revenue.Why it matters: Track by channel for real efficiency insight.
Bonus: Duplicate/contactability rateFormula: Percentage of duplicates and percentage of donors with valid contact info.Why it matters: Critical when scaling automation and AI-driven segmentation.
How to Calculate Fundraising Metrics Correctly
When it comes to how to measure fundraising performance correctly, the formulas are the easy part. The hard part is definitions.
Most nonprofit KPI errors come from inconsistent logic, not bad arithmetic. Before building any dashboard, document these decisions clearly.
What counts as revenue? Do you include pledges on commitment or collection? Are soft credits included? What about in-kind gifts?
What defines a "new donor"? First gift ever, or first gift in your lookback window? The answer changes your retention math significantly.
Calendar year or fiscal year? Neither is universally right, but consistency is essential. Blackbaud community discussions show this is one of the most common sources of reporting confusion. Power BI community questions frequently come down to the same issue: how do you correctly classify new, returning, and lapsed donors when your year boundary shifts?
Common formula mistakes to avoid: mixing donors and gifts as denominators, changing definitions mid-year, counting transactions instead of unique donors, comparing gross to net across channels, and failing to include staff costs in event ROI.
Create a short definitions playbook. Share it with every person who touches your data. Update it annually.
Common Fundraising Metrics Mistakes
Even well-intentioned measurement programs break down. Here are the patterns that cause the most damage.
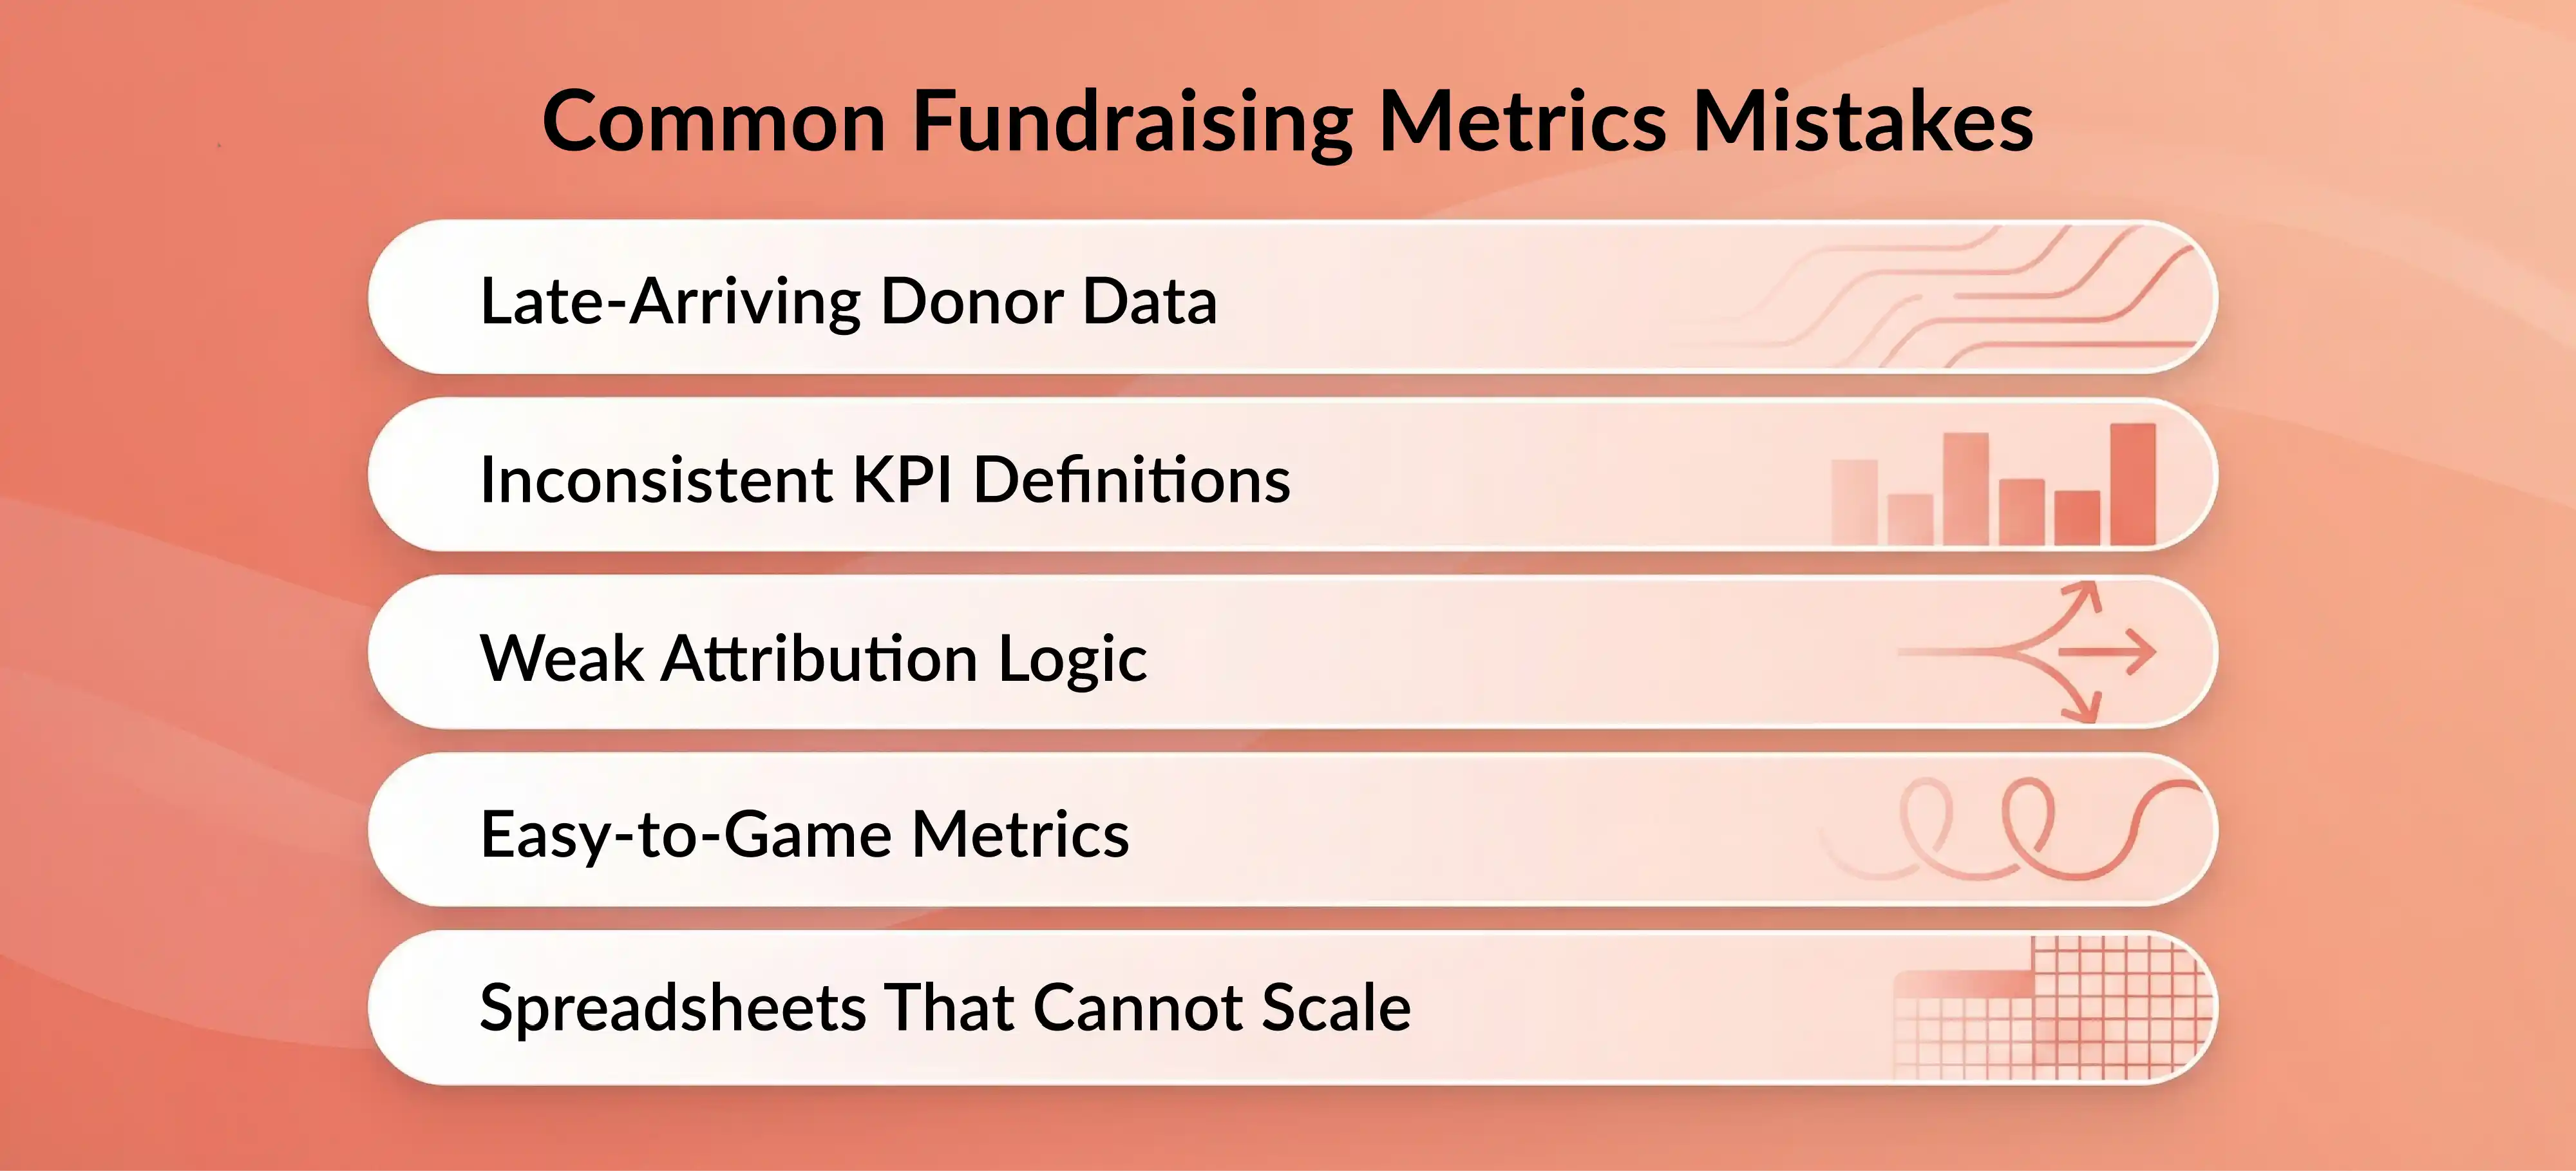
Data latency. FEP explicitly cautions that a significant amount of donor data arrives late. Checks, DAF distributions, event reconciliations, and batch imports all land after "month-end." If your snapshots don't account for this, your numbers will keep changing and your team will lose trust in the data.
Definitions drift. One team's "retained donor" may not match another's. In Salesforce communities, donor retention reporting discussions reveal that multi-year retention logic varies widely across implementations. Lock your definitions down.
Attribution problems. Email-source, campaign-source, and multi-touch attribution all have limits in nonprofit contexts. Be practical. Focus on directional accuracy, not false precision.
Metrics that incentivize wrong behavior. Activity quotas that don't reflect donor reality, event success judged by attendance rather than net return, and major gifts "counting" only under certain internal rules. If a KPI is easy to game, it will be gamed.
Spreadsheets that can't scale. SQL-based retention questions on Stack Overflow and cohort analysis struggles in Power BI forums show a common pattern: teams outgrow spreadsheets once retention, attrition, and cohort analysis become complex. That's normal. Plan for the transition before it becomes a crisis.
How to Build a Nonprofit Fundraising Dashboard That Helps Decisions
A useful fundraising metrics dashboard is simple, segmented, role-based, and action-oriented.
The executive dashboard: 8 to 12 KPIs
Keep leadership dashboards concise. Recommended core set:
Total fundraising revenue, net fundraising revenue, donor retention rate, new donor retention rate, cost to raise a dollar, recurring donor revenue, major gift pipeline value, revenue concentration ratio, year-over-year growth, and percentage of goal achieved.
These belong at the executive level because they show financial health, donor-base health, efficiency, and risk in a single view.
The development team dashboard
Your development department needs more operational detail: new donors acquired, donor acquisition cost, online donation conversion rate, list growth rate, page completion rate, payment failure rate, recapture rate, proposal count, stage velocity, and stewardship completion.
Good donations and donor tracking makes this level of reporting possible. Without clean data flowing into a reliable member database, even the best dashboard design falls apart.
Board reporting
Boards need trend, risk, and financial stewardship. Not tactical clutter.
Show them a quarterly scorecard with five to eight KPIs, a brief narrative explaining what changed and why, and one or two forward-looking risks. Leave channel-level detail for the management team.
Review cadence
Monthly: channel performance, conversion, pipeline movement, recurring payment issues.
Quarterly: strategy shifts, budget reallocation, benchmark comparisons.
Annually: full-year trends for fundraising analytics, target-setting for the next year, and definitions review.
For associations and membership-based nonprofits, membership management software with built-in insights and reporting can support cleaner renewal, payment, and member activity data, which directly improves reporting quality. Pairing that with automated renewal reminders helps sustainer retention show up as a real number rather than a guess.
Best Practices for Improving Fundraising Performance With Metrics
Metrics without action are just reports. Here's how to turn measurement into improvement.
Prioritize donor retention before chasing more acquisition. FEP data consistently shows that retention is the sector's most persistent challenge. A peer-reviewed study of DonorsChoose found that donors are more likely to return when they experience timely recognition and communication about impact. Track acknowledgment timeliness, impact update cadence, and follow-up completion as stewardship metrics alongside your retention rate.
Track net revenue and CPDR by channel. Some channels look strong in gross terms and weak in net terms. Events, acquisition campaigns, and labor-heavy programs all deserve this scrutiny. A community-centric fundraising approach helps reframe channel decisions around long-term relationship value, not just immediate return.
Build recurring giving as its own strategy. Monthly giving revenue, sustainer retention rate, payment failure rate, and upgrade rate form the core KPI set. M+R shows monthly giving already represents 31% of online revenue and it's growing faster than one-time giving.
Improve donation page conversion with device-level analysis. Don't blend mobile and desktop into one conversion rate. Test fewer fields, default monthly options, clearer ask arrays, and better mobile UX. Small improvements compound into meaningful revenue gains without additional traffic spend.
Track concentration risk before it becomes a budget crisis. Measure what percentage of revenue comes from your top 10 donors, your largest grant, and your primary event sponsor. Pair that number with pipeline depth and recapture planning.
Improve data hygiene before scaling AI. Duplicate records, missing source codes, and inconsistent definitions produce bad decisions, and AI makes them faster. Clean your data first.
Real-World Examples of Metrics Improving Results
Fundraising metrics are not "just reporting." They change outcomes.
A Graphcom case study with Good Shepherd Rehabilitation Network shows measurement-driven segmentation in direct mail: their first appeal cost 65% less than the previous year's mailing, and CPDR dropped to $0.64. The transferable principle is clear. Track costs and response by segment, then cut what doesn't work.
A Stirista audience profiling case study reports CPDR reduced from over $400 to $80 through tighter audience targeting. Regardless of vendor choice, the lesson holds: segment-level measurement improves acquisition efficiency.
Windmill Hill Consulting's work with Rebuilding Together started with a 16% donor retention rate. After analytics-driven segmentation and stewardship improvements, retention improved and major donors grew by 50%.
The pattern across all three: better tracking led to better segmentation, which led to better decisions, which led to measurable improvement.
When choosing the best donation software for your organization, prioritize platforms that make this kind of segmented tracking possible from day one.
How to Set Fundraising KPI Targets for 2026
Start with a three-year internal baseline. Your own trend data is usually more actionable than generic sector averages.
Adjust targets by channel, donor segment, and organization size. The same target should not apply to major gifts, digital, direct mail, recurring, and events.
Set threshold, target, and stretch goals for each KPI. Assign an owner and a review cadence to every target.
Tie each KPI to a next action. A KPI without an owner or a clear response plan is just a number on a screen.
For example: if new donor retention is low, the action is a welcome series and a second-gift strategy. If payment failure rate is high, the action is a dunning process and card updater implementation. If Q4 dependency is extreme, the action is earlier list growth and pipeline building throughout the year.
Frequently Asked Questions About Fundraising Metrics
What are the most important fundraising metrics for nonprofits? The essentials for most organizations include total fundraising revenue, net fundraising revenue, donor retention rate, new donor retention rate, cost to raise a dollar, monthly giving revenue, donation page conversion rate, and revenue concentration ratio. These cover financial health, donor-base health, efficiency, and risk.
How do nonprofits measure fundraising success? By tracking both revenue outcomes and donor-base health together. Revenue alone is insufficient. Pair it with retention, acquisition, and efficiency metrics reviewed on a monthly and quarterly cadence.
What is a good donor retention rate? This varies by organization size, mission, and donor-file maturity. Use your own three-year trend as the primary benchmark and sector data from FEP reports as directional context. Improving your own rate year-over-year matters more than hitting an arbitrary number.
What is cost per dollar raised? Total fundraising expenses divided by total fundraising revenue. Track it by channel (direct mail, digital, events, major gifts) for useful insight, not just as a single blended number.
How do you calculate fundraising ROI? Net fundraising revenue divided by fundraising expense. Include all costs: staff time, vendor fees, platform costs, and allocated overhead.
What is the difference between fundraising metrics and fundraising KPIs? Metrics are all measures you can observe. KPIs are the subset tied to strategic goals and management action. Every KPI is a metric, but not every metric is a KPI.
What benchmarks should nonprofits use in 2026? Primary sources include Giving USA for macro trends, FEP for retention and donor behavior, M+R Benchmarks for digital and email, and Blackbaud Institute for seasonality and org-size performance. Always normalize benchmarks for your own context.
Which fundraising KPIs should development teams report monthly? Channel performance, online conversion rate, email CTR, pipeline movement, recurring payment issues, new donors acquired, and stewardship completion. Save strategy-level metrics for quarterly review.
Final Takeaway: The Fundraising Metrics That Matter Most
Here's the core insight for 2026: fundraising health has two trajectories running simultaneously. Revenue can rise while donor-base health weakens. A strong nonprofit KPI dashboard must track both.
The fundraising metrics that matter most are trustworthy, comparable, segmented, and tied to action.
If you're just getting started, begin with this core set: total revenue, net revenue, donor retention rate, new donor retention rate, monthly giving revenue, donation page conversion rate, CPDR, revenue concentration ratio, and major gift pipeline value.
Review them monthly. Revisit your strategy quarterly. Document your definitions before you scale your dashboard.
And remember, fundraising metrics are not reporting. They are a control system. In a year where fewer donors are carrying more of the load, the organizations that track donor-base health alongside revenue will be the ones positioned to grow sustainably.
Ready to improve how your organization tracks member and donor data? You can book a demo or start a free trial to see how cleaner data powers better fundraising decisions.
References
- Giving USA Foundation. Giving USA 2025: U.S. Charitable Giving Grew to $592.50 Billion in 2024
- Fundraising Effectiveness Project. Q4 2024 Full-Year Report
- Fundraising Effectiveness Project. Quarterly Benchmark Reports
- Blackbaud Institute. 2025 Charitable Giving Data Spotlight
- Reddit r/nonprofit. Did the Math on Our Gala
- M+R Benchmarks. Key Findings 2025
- M+R Benchmarks. Email Messaging Benchmarks
- Reddit r/nonprofit. What KPIs Does Your Nonprofit Use?
- M+R Benchmarks. Fundraising Benchmarks
- M+R Benchmarks. Website Performance Benchmarks
- Virtuous. 2026 Nonprofit AI Adoption Report
- Blackbaud Community. Donor Retention: Calendar vs Fiscal Year
- Reddit r/funanddev. Major Gifts Metrics and Countable Gifts
- Power BI Community. How to Calculate Lost Donors for Charity Data
- Salesforce Trailblazer Community. Donor Retention Reporting Discussion
- Stack Overflow. Calculating Attrition in SQL
- PMC / National Library of Medicine. DonorsChoose Donor Attrition Study
- Graphcom. Good Shepherd Rehabilitation Network Case Study
- Stirista. Audience Profile Tool Case Study
- Windmill Hill Consulting. Rebuilding Together Fundraising Case Study

Guides from the Experts
Through our work with 4,000+ organizations - we’ve put together helpful guides to assist; regardless of where you are on your journey.
.webp)

A Complete Guide to Membership Organizations
Everything you need to know to manage and grow your membership business
.webp)
Maximize Membership Retention: 10 Proven Strategies
Tried and true strategies that not only win membership, but keep them

Build a Membership Website: A Step-by-Step Guide
Your one-stop resource for knowing all the features your modern membership website needs
Ready to start your free trial?
Our membership software is intuitive to use and even easier to test for yourself.


.svg)
.svg)

